
Blog · 2026-09-23
Rhode Island's Median Home Price Rose 6.67% in August 2026. Here Is What It Really Means.
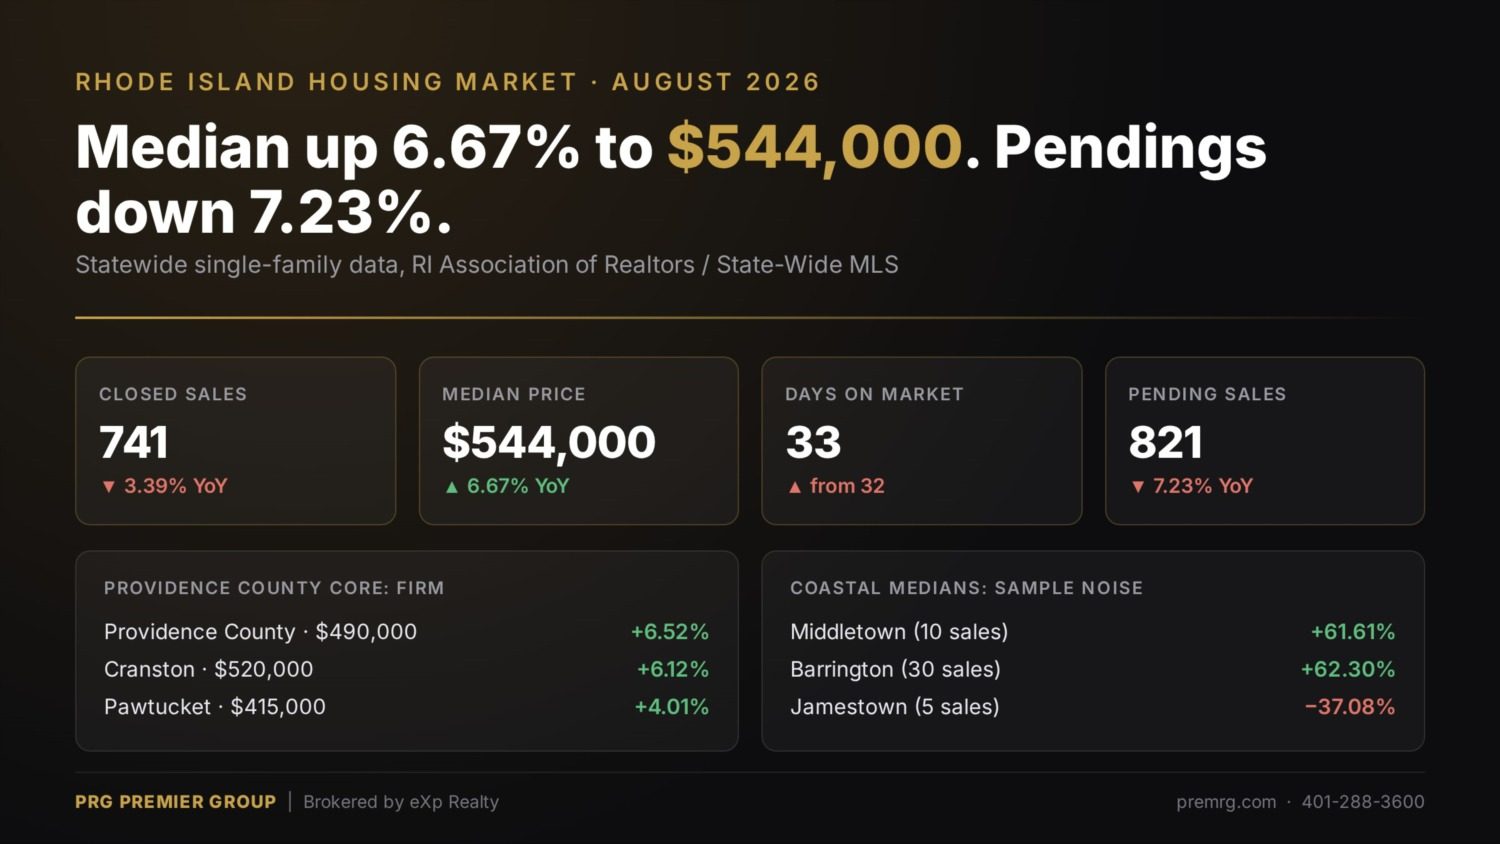
The Rhode Island Association of Realtors released August numbers on September 17, and the headline is easy to repeat: the statewide single-family median sold price was $544,000, up 6.67% from August 2025, while sales fell 3.39%. After 25 years brokering and appraising in this state, I read a headline like that closely before anyone prices a house off it.
Statewide: the numbers
Single-family. 741 closed sales, down 3.39% from a year ago. Median sold price $544,000, up 6.67%. Average days on market 33, up 3.13%. Active listings 1,719, up 8.32%. Pending sales 821, down 7.23%. RIAR puts single-family supply at 2.8 months.
Condominiums. 156 sales, down 13.33%. Median $407,455, up 1.86%. Days on market 38. Listings 520, up 27.14%, and pendings 204, down 16.73%. That is the softest segment in the state right now: more inventory and fewer buyers under contract.
Multifamily. 134 sales, down just 0.74%. Median $607,500, up 4.74%. Listings 429, up 15.95%. Days on market rose 35.71% to 38. Pendings 228, up 7.04%, the only category where contracts rose year over year.
Condo and multifamily supply is 3.5 months, against 4.9 months nationally per the National Association of Realtors. Rhode Island is still short on inventory, just less short than it was.
A median is not appreciation
The median is the middle sale of whatever happened to close that month. If more expensive homes close, the median rises even if no individual house gained a dollar. The State-Wide MLS prints that warning on its own town report.
August proves the point. Look at where the sales came from compared with last year:
- Bristol County closed 63 sales, up from 43, at a median of $810,000. Barrington alone closed 30 sales at a median of $1,298,375, up 62.30%.
- Newport County's median rose 36.01% to $950,000 on fewer sales. Middletown was up 61.61% to $1,065,000 on 10 sales. Newport was up 27.44% to $1,446,500 on 11.
- Washington County's median rose 16.92% to $760,000. South Kingstown was up 28.37% and Westerly 25.83%.
Meanwhile Providence County closed 23 fewer homes than last August, and Kent County 24 fewer. Fewer mid-priced sales plus more high-end sales moves the statewide middle up.
If those coastal medians were true appreciation, they would move together. They did not. Jamestown's median fell 37.08% to $995,000. East Greenwich fell 15.44% to $845,750. Narragansett slipped 4.29% to $1,115,000. Nobody's house in Middletown gained 61% in a year while Jamestown's lost 37%. These are samples of 5 to 26 sales, where a handful of waterfront closings swings the result.
As an appraiser, I value a house from the closest, most similar, most recent sales, adjusted for the differences. A statewide median is not one of those.
Where prices genuinely rose
Providence County is where most of my clients buy and sell, and its numbers are more reliable because the sample is bigger. The county closed 341 single-family sales, down 6.32%, at a median of $490,000, up 6.52%. Days on market held at 31.
Town by town:
- Cranston: 61 sales, median $520,000, up 6.12%, 28 days on market.
- Cumberland: 33 sales, up 37.50%, median $550,000, up 5.77%.
- Pawtucket: 33 sales, median $415,000, up 4.01%, 24 days on market.
- East Providence: 33 sales, median $441,000, up 3.76%.
- North Providence: 24 sales, median $481,000, up 14.52%.
In Kent County, Warwick closed 82 sales at a median of $437,000, up 1.63%, and Coventry closed 43 at $485,000, up 18.00%.
Not everything rose. Providence closed 55 sales at a median of $467,500, down 6.50%. Johnston's median fell 8.33% to $440,000 even as its sales increased. Woonsocket shows a 23.10% gain, but on 6 sales against 24 a year ago, which tells you nothing reliable.
The honest read: in the core of the state, prices are still rising, mostly in single digits, with steady days on market. Firm, not runaway.
The pending-sales signal for the next 60 days
Closed sales reflect contracts written in June and July. Pendings tell you what is coming. Single-family pendings were 821 in August, down 7.23% from 885 a year ago. They were also down year over year in June (6.28%) and July (5.76%). At the same time, listings are up 8.32% and days on market are creeping higher.
Expect September and October closings to track below last year, and expect buyers to have more choices than they had in the spring. RIAR also noted that the Federal Reserve raised its benchmark rate the day before this release, for the first time since 2023, and that a Fed hike typically leads to higher mortgage costs over time. RIAR's president said multiple offers over asking are "definitely moderating." That matches what I see at the table.
Seller takeaways
- Price off your comps, not the headline. A 6.67% statewide gain is largely a mix effect. Your price comes from the closest sales to your house.
- You have more competition than in the spring. Single-family listings are up 8.32% and condo listings 27.14%. Condition and presentation matter again.
- The first two weeks decide it. With days on market rising, an overpriced listing sits, and a stale listing negotiates from weakness.
- Condo owners, be realistic. Pendings down 16.73% with listings up 27.14% gives buyers leverage.
- Multifamily is holding. Pendings are up 7.04%, but days on market are longer, so price to the rent roll.
- Waiting is a bet. Falling pendings, rising inventory and a Fed rate hike do not point to a stronger fall.
What your home is actually worth
If you want a number built the way an appraiser builds one, from verified closed sales near you rather than a website estimate or a statewide median, reach out. Start at premrg.com or call my office at 401-288-3600.
Melissa Perrille, Broker/Owner, PRG Premier Group, Certified Real Estate Appraiser
Source: Rhode Island Association of Realtors / State-Wide MLS, August 2026 data, released September 17, 2026. Information deemed reliable but not guaranteed. Equal Housing Opportunity.